-
ABOUT US
-
ACADEMICS
Curriculum Program
Departments
- English
- High School Chinese
- Primary and Junior School Chinese.
- High School Mathematics
- Middle School Mathematics
- Primary School Mathematics
- Music and Fine Arts
- Physical Education
- Physics
- Chemistry
- History and Geography
- Physical Science and Optional courses Department
- Middle School Biology
- High School Biology
- Social Sciences
- Computer Science
- Courses in Primary School
Achievements and Matriculations
College Counseling
Science & Technology Innovation Contest
Subject Competition
-
ARTS
-
ATHLETICS
-
AT SHSID
SHSID ∣ TIMES
PTSA
Club Exhibition
- 龙吟社
- Live 2 Drama
- Choir
- Hip-pop Dance Club
- The Primary School Dance Troupe
- Symposiums Club
- Biology Workshop
- You Shan
- VEX Robotic
- Peking Opera Club
- Baseball Club
- Model United Nations
- The World Scholar’s Cup
- Future Problem Solving Club
- United States Academic Pentathlon
- OM Club
- AMC Club
- Music for Patients
- SHSID Gazette
- Smile Charity
- Cultural Moments
- SciAcademy
- Stem Doge Alliance
- Chinese Debate Club
- IAA
- Mock Trial Club
- Zhengming Club
- Furry Friends
- GT-Racing
- Village Radio
- IMMC Club
- Creative Design and Intelligent Fabrication
- Future City Research Project
- ECOCAP
- AdvocaSEA
- SPDC
- Medishine
- Floorball Club
- Animusic MTC
- Wings Up
- All Booked
- Cyano
- Birding Community
Health and Wellness
Campus Safety
Cafeteria Service
-
ADMINISTRATION
-
ADMISSIONS
-
ALUMNI
Alumni Information
Honors Students
- Class of 2025
- Class of 2024
- Class of 2023
- Class of 2022
- Class of 2021
- Class of 2020
- Class of 2019
- Class of 2018
- Class of 2017
- Class of 2016
- Class of 2015
- Class of 2014
- Class of 2013
- Class of 2012
- Class of 2011
- Class of 2010
- Class of 2009
- Class of 2008
- Class of 2007
- Class of 2006
Who Studied at SHSID
SHS Foundation
-
DOCUMENTS
Grade 9 Computer Science: Case Presentations of Data Analysis
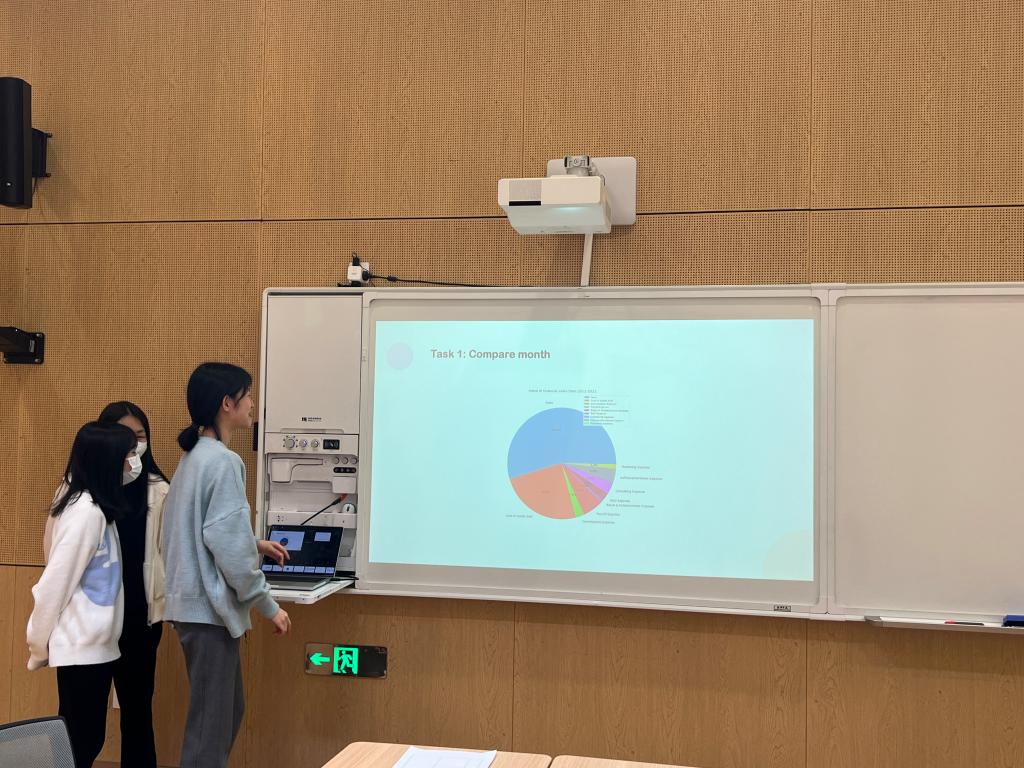
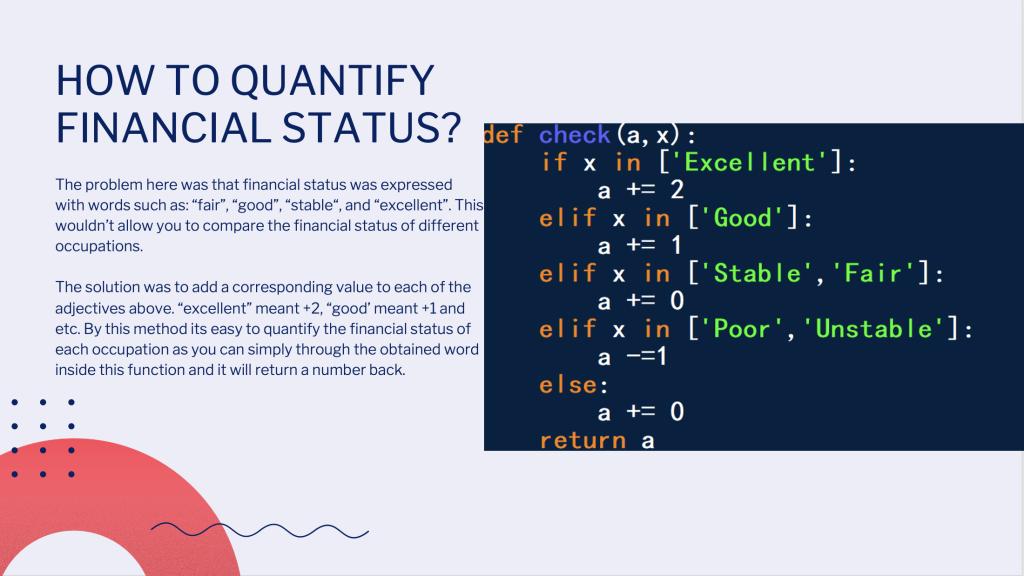
This semester, in the 9th grade computer class, when learning about data visualization, students used group learning to conduct case studies. The teachers assigned students a list of tasks and provided them with some learning resources for reference, allowing them to download them online and then work in groups for independent learning.
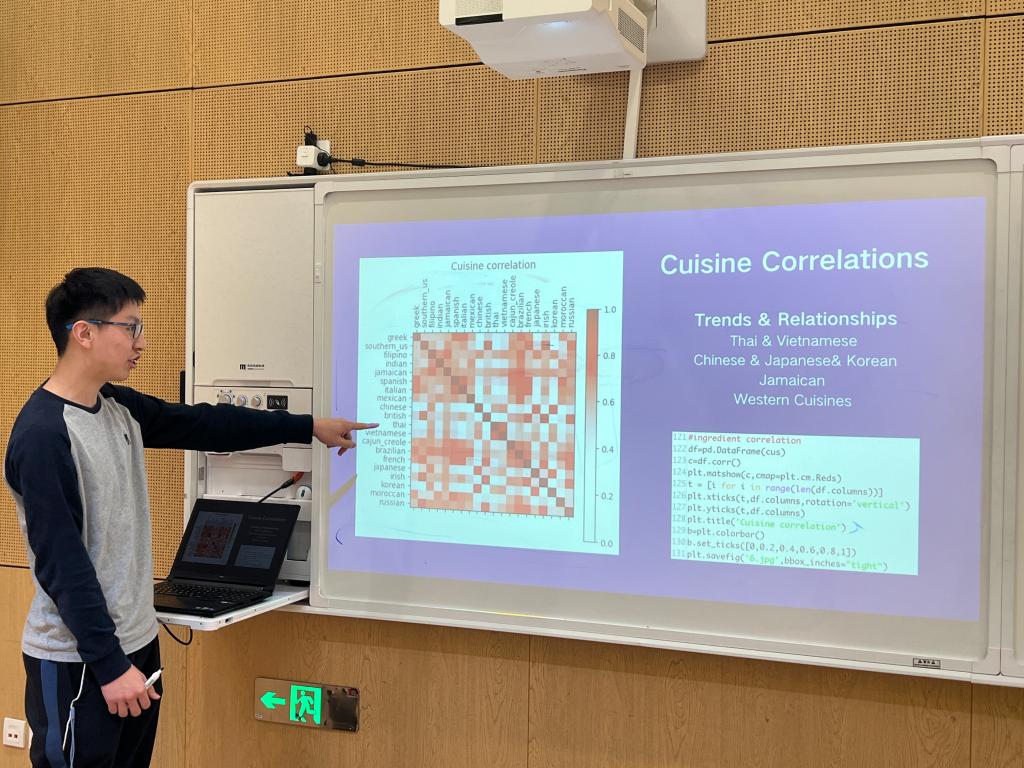
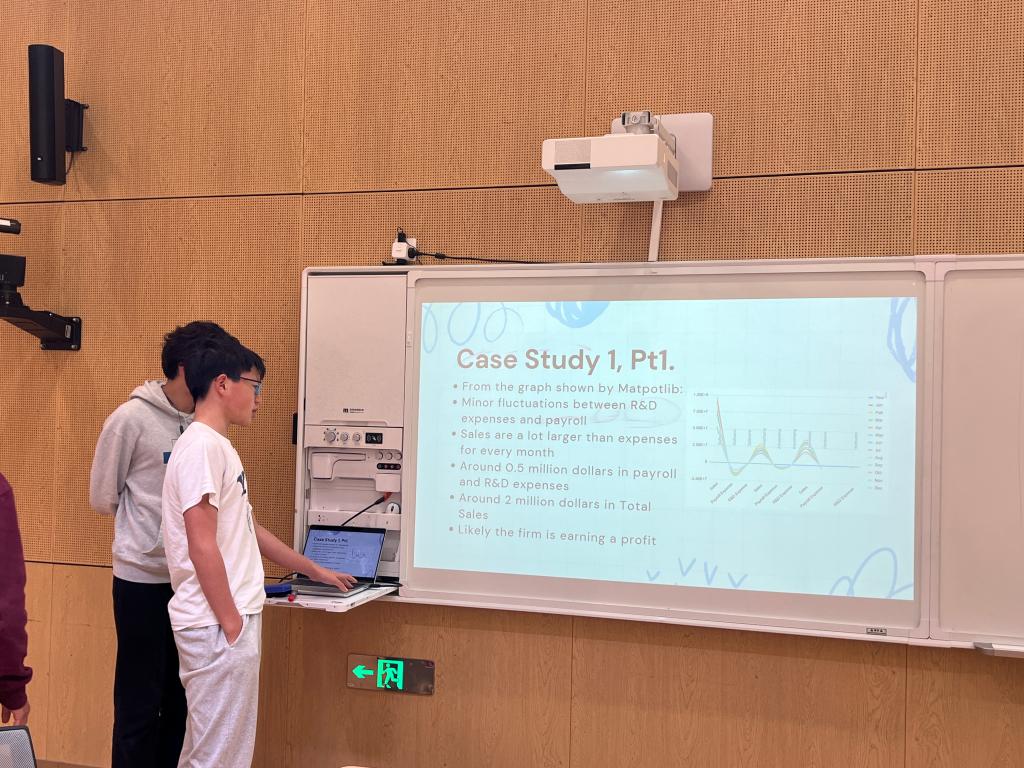
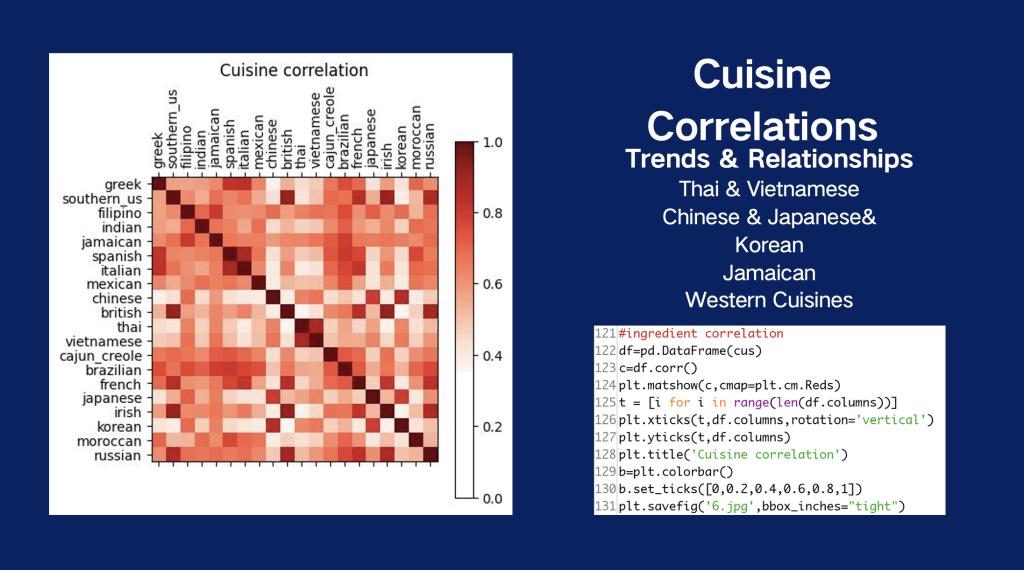
Amongst the case studies, one example was using visual charts to analyze the trend of some entities' quarterly financial cost changes in recent years. The choices also included the top 20 globally popular game rankings, as well as comparison of game publisher sales. Another interesting case was about the data analysis on the ingredients used in cooking in different countries around the world.
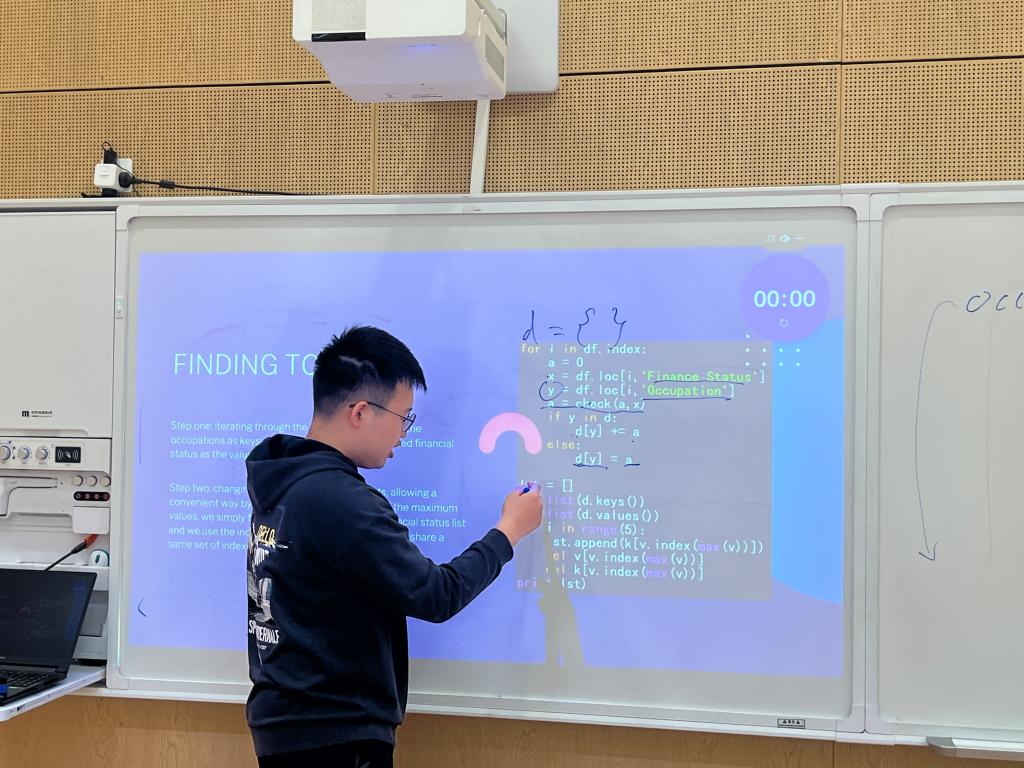
In the achievement presentation section, it could be seen that the students not only completed the tasks on the list, but also proposed their own innovative ideas. For example, some students came up with a unique method to quantify financial status, and another group of students used data correlation analysis to characterize the similarity between different ingredients, in order to classify similar cuisines. This can lead to the conclusion that similar ethnic cultures are likely to have similar cuisines. The whole process turned out to be a very effective learning experience.
(Written by Fei Zhao Pictures by Tianzhou He Reviewed by Qian Zuo)